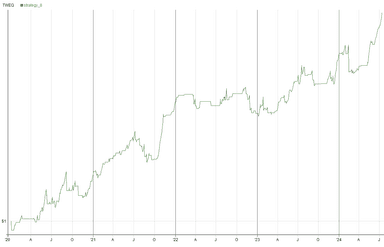
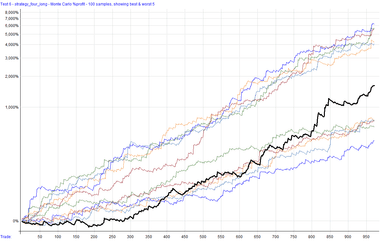
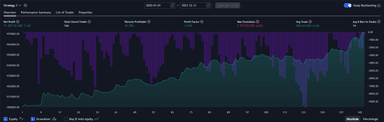
Strategy 8 -- A simple but effective momentum futures trading strategy
We are trading futures (micros) again. This one made $52K in the last 4 years with 1155 trades and a 78% win rate. PF 1.4, Sharpe 1.4, RoR 9.7%, MaxDD 6%
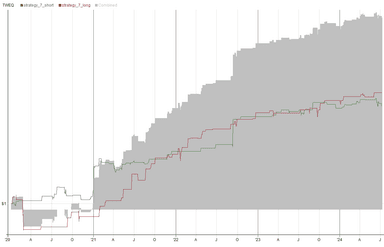
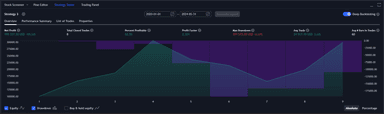
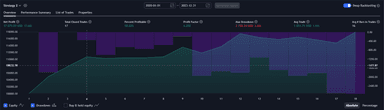
Strategy 7 – A mean reversion futures strategy.
We have a equities futures strategy that trades micros. It made $66k since 2020 with 377 trades, PF of 2.13, Sharpe of 1.51, RoR of 12%, MaxDD of -8.5%, and has a 59% accuracy on trades.
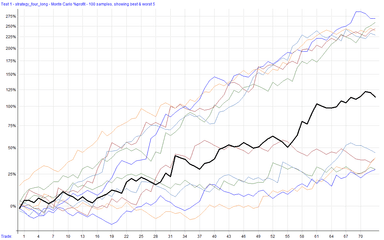
Strategy 6 — A lean mean-reverting machine.
I tweak a mean reversion strategy and test it against index constituents (current and delisted) from 2021 and got a ROR of 115%, MaxDD -20%, 59% win rate, PF 1.73, a Sharpe of 2.36 and 1,314 trades.
Strategy 4c — Unf***ing some mistakes from the last one.
A reader pointed out two things wrong with the previous variation of strategy 4. I addressed those issues, and our performance is now ROR 39.5%, PF 2.25, Sharpe 1.8, NP $110k, and MaxDD -7%.
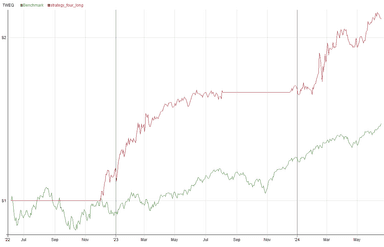
Strategy 4b — Small tweaks that improve performance
With a few small adjustments and a switch in data providers, we get a strategy that has a profit factor of 2.9, Sharpe of 2.2, MaxDD of -11.4%, win rate of 52%, and made $110k in the last two years.
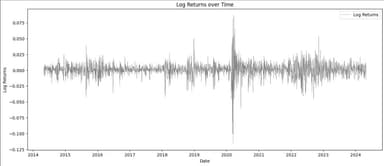
Logarithmic Returns – Why are they used in algorithmic trading?
A brief research note on logarithmic returns. Should we be using them?
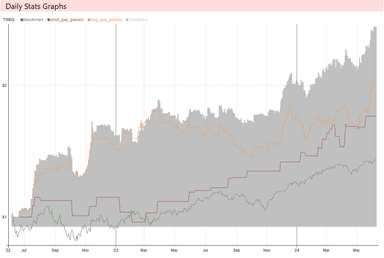
Strategy 5 – We’re cooking with gas now.
Finding an edge after the popular “Gap and Go” strategy. This strategy made $170k in the past two years (750 trades) with a 66% ROR, 15% MaxDD, 1.3 profit factor, and a 2.1 Sharpe ratio.
Strategy 4 – Beats the buy-and-hold SPY benchmark in profit and max drawdown.
This strategy uses RealTest for backtesting. It made $1.2 million on a universe of stocks (S&P 100) over the last 10 years, has a profit factor of 1.89, a Sharpe of 1.17.
Strategy 3 – Is two better than one? It’s certainly more than one…
Let’s turn it up by one. We’ve got two indicators, a trailing ATR stop, some daily charts, profit factors between 2-5 one different asset types, and some ponderings.
Strategy 2 – One indicator on a daily chart
Today’s strategy only uses 1 indicator and has a profit factor over 2.0 on multiple instruments tested.
Strategy 1 -- A simple trading strategy for manual or automated trading
This strategy only uses two indicators, has no optimization, and has a profit factor of 5.9 with a profit of $13k on one ES contract in out-of-sample testing (2024).
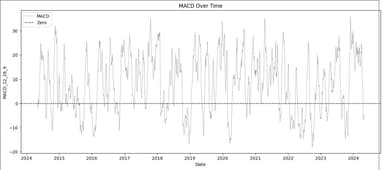
Researching the MACD Indicator in Python
The last indicator to research before trying to create a strategy. Spoiler, one of our visualizations shows us one of the trade entry criteria we are going to use in the near future.
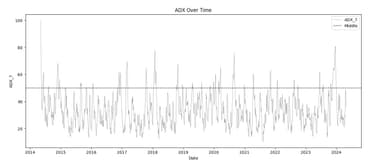
Researching the Average Directional Index in Python
Two indicators in one, or is it technically 4 indicators in one? Either way, there are indicators, graphs, math, and code! Still got the PDF too.
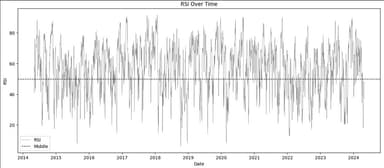
Researching the Relative Strength Index in Python
We've got math, code, charts, and scatter plots in this one. It's open to all subscribers and it even comes with a PDF!

Testing Indicator Soundness for Automated Trade Systems, Part 3
The final chapter of our series might mark the end of this quest, but I've got to wonder... was this all just the tutorial level?
Research Notes: The Mann-Whitney U Test
Research notes and Python code for calculating a one-sided statistic. Lot's of technical jargon in this one but its good information. So, don't skip it.

Testing Indicator Soundness for Automated Trade Systems, Part 2
We're gonna take a look at mutual information. There are words like "stationarity", "permutation", and "discretization". There is even some code, broh.

Testing Indicator Soundness for Automated Trade Systems, Part 1
The first part in a series about testing our indicators' capacity to carry information.